From this point on, I considered each of the pieces of our data separately, because they lent themselves to separate analyses. I divided the data into the following categories:
- American Literature by Century
- American Literature by Type of Work
- American Literature by Authors
- American Literature by Works
- American Literature by Subjects
American Literature by Century
Our collection of subject dates is the easiest to work with. In the records, each article has metadata indicating the century to which the literature it analyzes belongs — the subject dates. These are relatively easy to analyze because:
- They include a relatively small number of values
- The dates are comparable to each other in an obvious, straightforward fashion.
- It’s easy to know what questions we want to ask.
I’ve made the data available here as a CSV file, but it’s probably easiest to use some sort of spreadsheet software to tabulate the data and create simple visualizations. I used Microsoft Excel for this purpose, but you could do the same with GoogleSheets or a free and open source spreadsheet alternative.
The software I used has a function allowing me to count the number of occurrences for a specific string in a set of cells, so I organized the cells by publication year of the article (1950, 1980, or 2010) and made a table for each subject period and one for the data overall.
American Literature by Type of Work
This existence of a “genre” field which is apparently close in meaning to the “work classification” field complicates our consideration of the types of work covered in the journal. I considered carefully whether to combine these two fields. The values of the two fields are often similar, and in all cases but one, “genre” appears to replace “work classification.” However, the fact that the Bibliography goes to the trouble of including both these fields suggests that a difference exists. This difference might be a hierarchical one — that is, it might exist at a different level of specificity in the vocabulary of the index. It was risky to combine fields when I didn’t fully understand why they are separate, but I wanted to get the most accurate understanding that I could of the subject matter of the journal. Ultimately, I did combine them. Thus, the “Type of Work” data didn’t perfectly mirror the records; it was an amalgamated category for these two fields.
Once again, I made a table of the different types of works appearing in the metadata, checking for duplicates as described above:
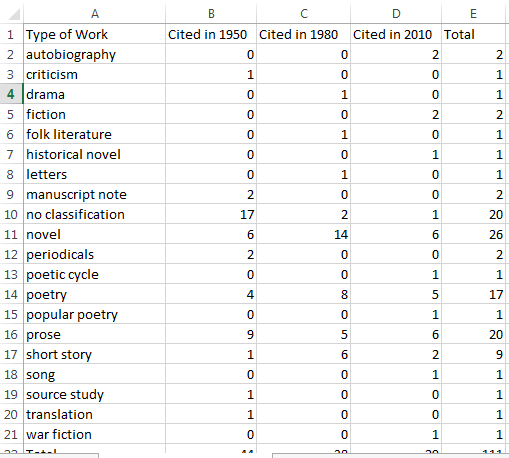
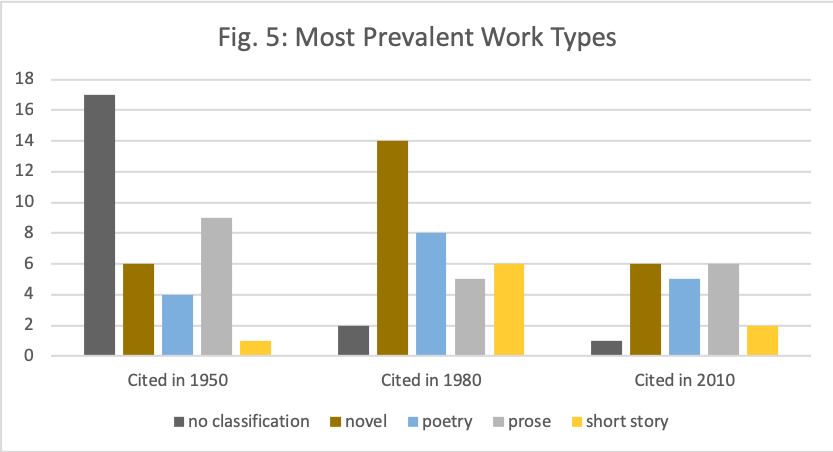
This seemed like a lot of categories, making the data difficult to search for patterns. In fact, most of the categories include fewer than five items. Records without categories and items in three categories, “novel,” “poetry,” “prose,” and “short stories,” made up most of the list. One way of dealing with this kind of data was to look only at the items that dominate the list, so for instance, I could visualize just these three:
But this didn’t seem right to me. Why were we giving so much attention to these different types of prose? What if the categories I discarded actually added up to something important? Did this analysis underestimate the amount of criticism published about prose by leaving out the autobiographies and other prose genres?
My answer to this problem was to sort each type of work into a larger category. The typical “genres” that literary criticism often uses as starting points are poetry, prose, and drama, so that seemed like a good place to start. For works that are formally subsets of one of these types, I grouped them into the larger group (that is, “novel” went under “prose”, “poetic cycle” under “poetry”). “Letters” and “criticism” were assumed to be prose.
Some of the types of works didn’t fit neatly into these categories, so I created an “other” category. For instance, “manuscript notes” aren’t exactly prose in the sense we’re using for the other works here — they’re just notes. There is a translation in the data, which could be prose, poetry, or drama. Folk literature and songs didn’t begin life in the form of the written word, and while it’s possible that the authors of the articles in which they’re analyzed focused on written texts, as poetry or prose, I couldn’t know that for sure without examining the articles themselves. While it’s generally preferable not to include miscellaneous data categories, this approach helped us to identify the biggest categories more easily.
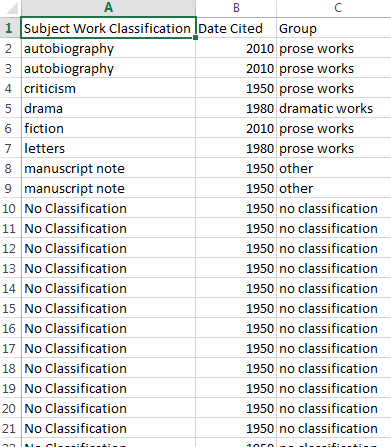
work_classification_grouped.csv
Duplicate Data Strikes Again!
There was one more problem with this kind of grouping. When I initially compiled the dataset, I eliminated duplicate data from within the same record. However, by collapsing the categories into groups, it’s possible that I might have undone some of that work. For instance, if “prose” and “source study” both occurred in the same record, this method would result in counting it twice. In fact, there are a few cases in which that happened. This means I’m not counting the number of articles about a particular kind of work, but strictly counting the application of a particular label or type of label (an approach that could distort our analysis if any articles are extreme outliers in that respect). So, in the data below, we can say that labels describing prose works are very common; it’s a little harder to say that articles about prose works are as common.
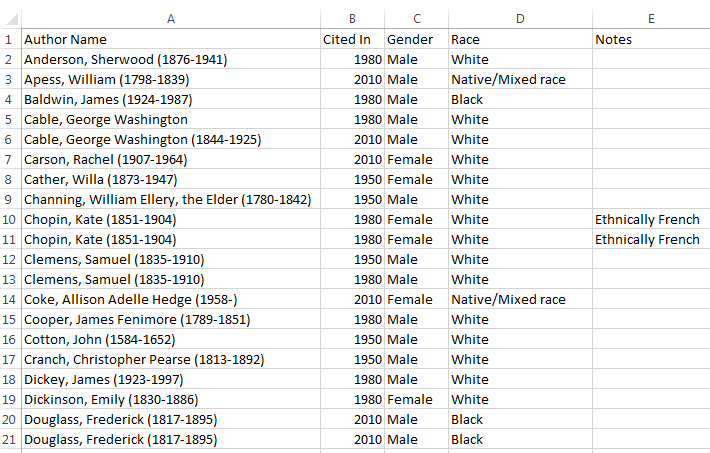
American Literature by Authors
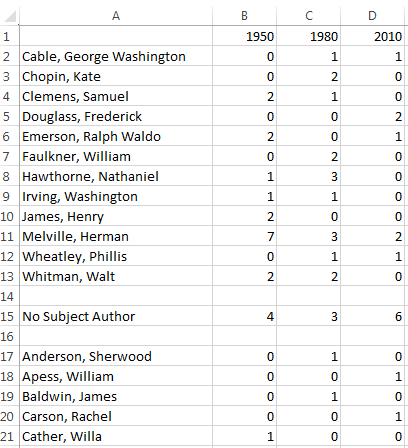
This is a much longer list than the ones we’ve worked with so far! To figure out exactly how much longer, I made a table that consolidated my list of authors by year cited. Sixty-two different subject authors were included in the metadata for these three years; only 12 were mentioned more than once. The only three mentioned more than three times were Walt Whitman (4 times), Nathaniel Hawthorne (4 times) and Herman Melville (12 times).
This wasn’t very useful, because I didn’t have a large enough sample to draw conclusions about the extent to which American Literature features certain authors in their articles. Melville is clearly important, but many authors are analyzed in exactly one article, including very famous ones like Emily Dickinson and Robert Frost along with much more obscure authors like Bret Harte and primarily non-literary authors like Thomas Jefferson. If our data captured a broader look at the work published in American Literature, we would likely see much more work on Dickinson than on Harte. There are so many authors in play that it wasn’t especially surprising for any one author, even an important one, to be only cited once in a year, or not cited at all.
Each year has a few records without a subject author. In some cases, these are bibliographies of other contemporary work or pressing issues in the field. Other articles analyze a group of works, without focusing on one author in particular. For instance, 2010 has one article on World War I narratives and another on the speculative fictions of slavery. This means, of course, that our list of authors whose work is analyzed in the journal is incomplete.
Coding Authors
The subject authors gave me an opportunity to partially answer one of my research questions: How did the canon of American literature change in the twentieth century? Are scholars writing about different authors now than they did previously? Is more attention being paid to women authors and authors of color?
To answer that question, I needed to be able to identify authors by gender and race. This was problematic for several reasons!
First, it required me to slot people into reductive, simplistic categories, which may or may not match their own sense of their identity. I classified Willa Cather as a woman here; I wasn’t completely certain that this is how she identified, and since I’m not a Cather scholar, I’m aware that there are questions about this, but I’m ill-suited to make a strong argument for any particular gender. For the purposes of this analysis, I put her among the women because it seemed that most critics do. This is one problem with projects that cover multiple authors; it’s very likely to bring up authors with whom one isn’t familiar, so making distinctions like this can be difficult.
Race was also complex. Because I was working with a small dataset, I looked up each author in an attempt to find the most appropriate way to identify them. Note that the “Group” category I left out of the analysis might have been helpful here, since it often identifies authors in this way (for instance, as “African American woman poets”). However, it is also inconsistently applied. Both there and in other sources, authors are more likely to be “marked” as belonging to a group if the group varies from a perceived norm; thus, since American culture treats whiteness as an unmarked default, it is much easier to find out whether an author is of color than it is to confirm that an author is white, both in MLA and elsewhere.
I tried not to make too many assumptions, but it’s entirely possible that I was incorrect in some places. Two of the authors in this sample were also biracial; in this case, they were Native and white, and I counted them as Native because I wanted to analyze to what extent the journal was publishing criticism on Native American authors.
In addition to the problems of who might fit in which categories for the purpose of this analysis, it was also problematic to use these categories in an apparently straightforward, unquestioning way. Gender and race are complex, ever-shifting social constructs which play a large role in how people (and, by extension, the works of art they produce) are received. This means it’s important to pay attention to them, but when we don’t acknowledge the history and complexity of these categories, we run the risk of reinforcing them and treating them as “natural.” Digital humanities scholars are thinking carefully about this complicated problem.
However, I did need to include information on both gender and race in order to identify underrepresentation. My imperfect, provisional result was this:
This analysis did not take into account that some authors are the subject of multiple articles, nor the fact that some articles are about multiple authors! Thus, it did not evaluate (for instance) the number of women whose work was analyzed, nor the number of articles about works by women — only the number of times a woman was named as a subject author. Collapsing the works about the same author would produce different results.
Again, the risk of this approach is that if our data included an article with a much larger number of subject authors than the others, it would dominate our analysis.
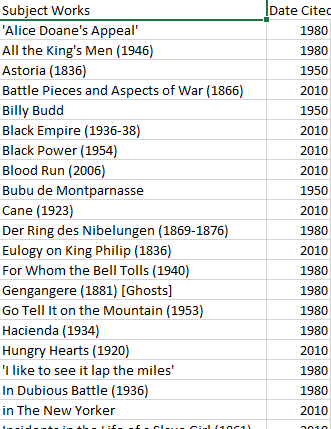
American Literature by Works
When I began, I thought this would be an important category of metadata. However, we run into the same problems we do with many of the other categories: this is a list of sixty-nine items, with sixty-six different entries! For the curious, the works mentioned more than once were: Roughing It (mentioned in 1950 and 1980), The Confidence Man (mentioned in 1950 and 1980), and The Grandissimes (mentioned in 1980 and 2010).
If we had chosen to break the works into groups, we might have gotten interesting results — but much of this work was already done in the rest of the metadata! We already had data about types of work, centuries published, and the authors.
Thus, while I made a list of works, I did no other analysis on this material, except to note that there are many more nulls in 1950 than in the other years.
American Literature by Subject
The subject terms, even more than the other data I considered, revealed information about both the publication practices of this journal and at the indexing practices of the Bibliography. Subject terms are assigned by the MLAIB‘s field bibliographers using a controlled vocabulary developed for exactly that purpose, so it was important to be aware that the changes we notice in the data could reflect a change in the journal’s scope, or possibly differences in indexing practices.
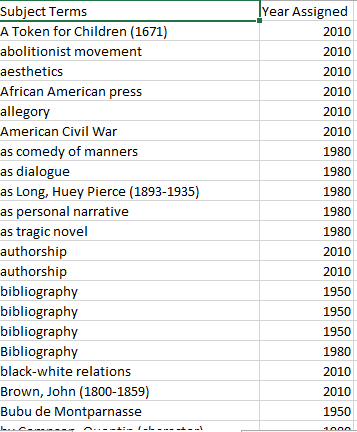
One obvious difference is the number of terms assigned each year; this will be considered further in the Analysis section.
As I noted in the other sections, the weakness of analyzing the terms term by term rather than record by record is that records with a high number of terms are better represented in our data.
However, aside from the sheer number of terms, this list of subject terms didn’t offer any obvious, immediate path to analytical conclusions — much like many of the other datasets we looked at here. I made a decision to code the subject terms, breaking them into groups for analysis. Under ideal circumstances, I could cross-check these with another person, but the time constraints of the current project prevented that approach.
Note that this is very different from the kinds of coding I did on previous iterations of this data, because here, I made up my own categories. Thus, my analysis depended very heavily on what kinds of categories I assigned and how I understood those categories. Note that it isn’t always necessary to make up your own terms. Often, vocabularies have already been developed and documented by other researchers; other times, it may be possible to access the categories into which the terms were originally placed by the organization that developed the vocabulary.*
Nobody should trust my analysis without taking a good look at the categories I developed! This is where a data dictionary comes in handy. It helps the future users of my data to understand the decisions I made, and, as an added benefit, writing it helped me to develop my thinking further, and eliminate the categories I couldn’t explain well.
 Loading...
Download as txt (recommended) [4 KB]
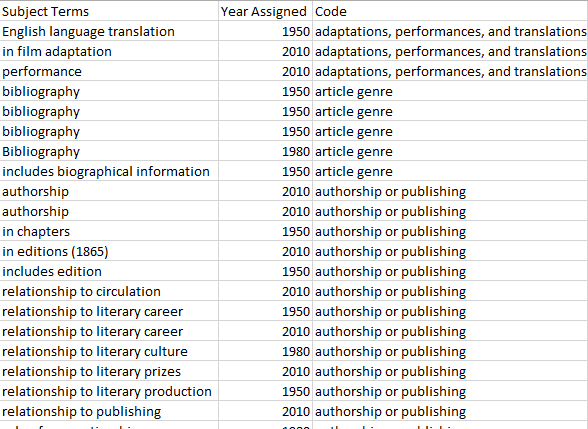
Of course, these categories were deeply rooted in my own point of view; there is no reason to think someone else looking at this data would come up with the same analysis. However, it’s worth noticing that some of them, like those I’ve labeled “philosophical concepts” or “rhetorical techniques” were about the aspects of the work being analyzed, while others were about the author, or relationships among works, or even the article itself.
I also removed any subject terms that reiterated the title of a work listed in subject works or the name of the author listed in subject authors, except where the term referred to influence on an author.
*Subject terms, in many cases, are part of a hierarchical vocabulary with their own implied context. However, these are not always visible or legible to the end user, in this case me.
Continue on to the next section…
Back to the table of contents…

This entry is licensed under a Creative Commons Attribution-NonCommercial-ShareAlike 4.0 International license.